Statistical Example: 360-Degree Virtual Tour in Practice
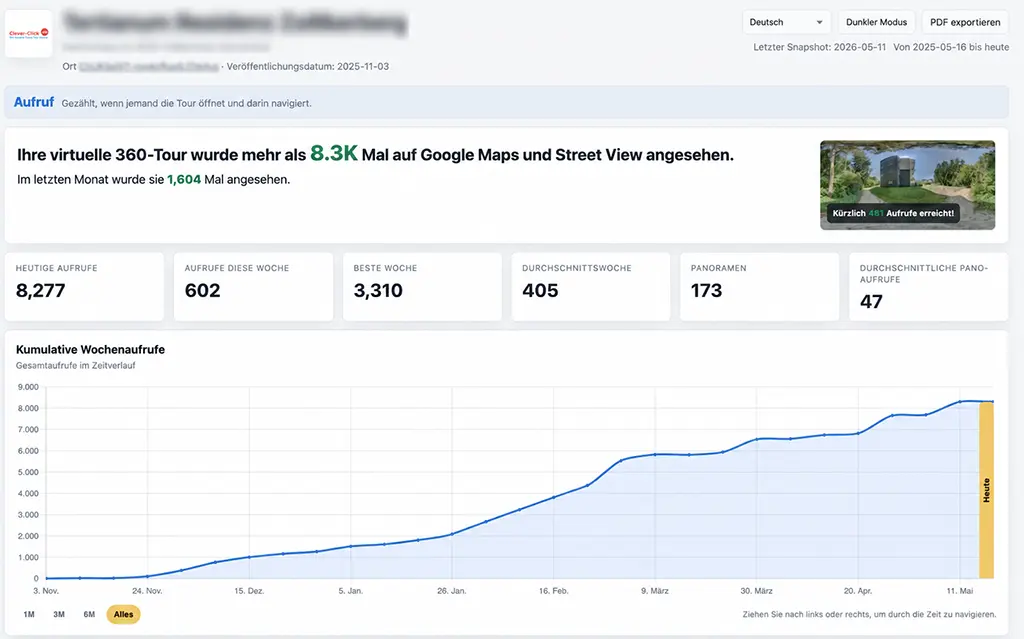
Interpretation of the figures:
- Total to date: over 8,277 views
- Last month: 1,604 views
- Best week: 3,310 views
- Average week: 405 views
- 173 panoramas in total
- Average of 47 views per panorama
Notable:
The curve rises almost continuously. No slump, no stagnation. This suggests that the tour is being found over the long term and that Google is actively displaying it.
The “best week” with 3,310 views was likely triggered by:
- increased Google visibility
- seasonal demand
- marketing activity
- increased search queries for the location
The figure “47 average panorama views” is also relevant:
173 panoramas × 47 ≈ 8,131 total views. This matches the total number of 8,277 almost exactly.
Particularly strong:
1,604 views in the last month correspond to:
- approx. 53 views per day
- or approximately 1 access every 27 minutes
For a single senior citizens’ home, this represents very high digital visibility.
From a marketing perspective, this means:
Interested parties, relatives, and potential employees are already viewing the facility online before they:
- Contact us
- book a viewing
- apply for a position
- compare institutions
The statistics also prove:
Virtual tours generate long-term reach without ongoing advertising costs. The curve continues to rise months after publication.